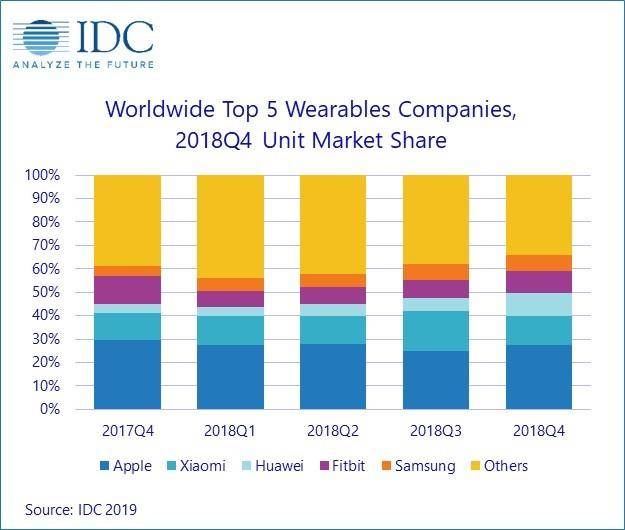
A week ago we’ve seen figures from Strategy Analytics concerning the smartwatch market, and they are putting Apple in the dominating first place. By comparison, IDC’s numbers and top rankings are somewhat different, but they still have Apple and its Apple Watch on the top spot. The iPhone-maker shipped 16.2 million wearable devices in the last quarter of 2018, of which 10.4 million were Apple Watches. The number is a tad higher than the one reported by Strategy Analytics.
Xiaomi comes in second after Apple according to IDC, with the Mi Band 3 accounting for over 30% of all wrist bands shipped during the quarter. Huawei grew 248.5% in the wearables sector, driven mostly by its 43% smartphone growth. Fitbit follows with Samsung closing the top 5 list with its 4 million units shipped during the quarter. Like Huawei, Samsung’s performance is attributed to the fact that many of its smartphones come bundled with some sort of wearables. Check out the numbers below, or follow the source link for the complete report.
|
Top 5 Wearable Companies by Shipment Volume, Market Share, and Year-Over-Year Growth, Q4 2018 (shipments in millions) |
|||||
|
Company |
4Q18 Shipments |
4Q18 Market Share |
4Q17 Shipments |
4Q17 Market Share |
Year-over-Year Growth |
|
1. Apple |
16.2 |
27.4% |
13.3 |
29.6% |
21.5% |
|
2. Xiaomi |
7.5 |
12.6% |
5.2 |
11.6% |
43.3% |
|
3. Huawei |
5.7 |
9.6% |
1.6 |
3.6% |
248.5% |
|
4. Fitbit |
5.5 |
9.4% |
5.4 |
11.9% |
3.0% |
|
5. Samsung |
4.0 |
6.8% |
2.0 |
4.3% |
105.6% |
|
Others |
20.3 |
34.3% |
17.6 |
38.9% |
15.6% |
|
Total |
59.3 |
100.0% |
45.1 |
100.0% |
31.4% |
|
Source: IDC Worldwide Quarterly Wearables Tracker, March 5, 2019 |
|||||
|
Top 5 Wearable Companies by Shipment Volume, Market Share, and Year-Over-Year Growth, 2018 (shipments in millions) |
|||||
|
Company |
2018 Shipments |
2018 Market Share |
2017 Shipments |
2017 Market Share |
Year-over-Year Growth |
|
1. Apple |
46.2 |
26.8% |
33.1 |
24.5% |
39.5% |
|
2. Xiaomi |
23.3 |
13.5% |
16.1 |
11.9% |
44.6% |
|
3. Fitbit |
13.8 |
8.0% |
15.4 |
11.4% |
-10.0% |
|
4. Huawei |
11.3 |
6.6% |
4.6 |
3.4% |
147.3% |
|
5. Samsung |
10.7 |
6.2% |
5.8 |
4.3% |
85.1% |
|
Others |
66.8 |
38.8% |
60.0 |
44.4% |
11.2% |
|
Total |
172.2 |
100.0% |
135.0 |
100.0% |
27.5% |
|
Source: IDC Worldwide Quarterly Wearables Tracker, March 5, 2019 |
|||||