When a new device is announced or rumored, we obsess over every last specification. And if the device – or purported device – is considered to be a flagship, yet doesn’t offer the gold standard in every area (display, CPU, GPU, RAM, storage, connectivity, design, build quality and materials, etc.), we’re up in arms.
“Why, Samsung? Why?”
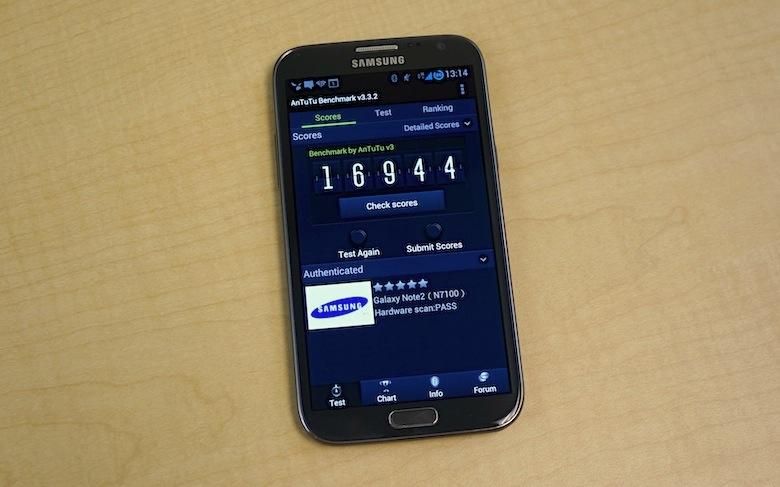
Any new phone or tablet, once we get our hands on it, goes through the same, rigorous torture. Among all our personal applications and data, we install a set of synthetic benchmark applications – AnTuTu, Quadrant Standard, Geekbench, Smartbench, Linpack, and more. Multiples tests of every benchmark are ran, and we average them out for the full review.
Quite literally, for hours with each device, I stand over it pressing a Begin test button, waiting for the test to finish, record (screen cap) the result, and start over. Some benchmark tests take a split-second, such as Linpack. Others take upward of four hours, like the AnTuTu Tester battery benchmark.
We do this for a couple reasons.
One, it’s impossible to quantify – numerically and scientifically – how great a mobile device’s performance is simply by using it. We can tell it operates smoothly, that transitions and animations aren’t overbearing, that unopened applications open and load quickly, or that task switching occurs in an acceptable time frame. But it’s impossible to gauge the inner-workings of a device’s components and how well they work together on a standard level by guestimating with our humble, weary eyes.
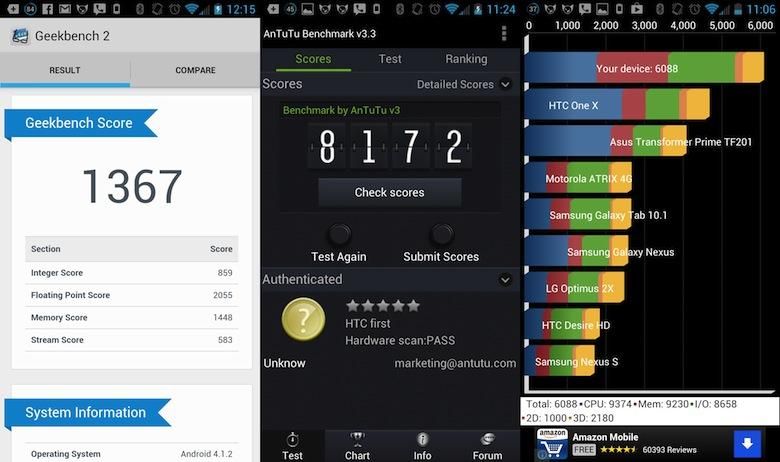
HTC First benchmark scores from the review
Two, if we don’t, readers and viewers blow all their gaskets and subject us all to a hate-filled, verbal lashing, and suggest we all get lynched, multiple times each.
Okay, maybe I’m exaggerating a bit. No less, it’s our duty and, well, it’s quite fun to see how devices compare to one another in various tests, even if most of us have absolutely no clue what the arbitrary four- or five-digit number readout from a test actually means.
However, the more you test devices, the more times you hit the Test again button, the more you see how useful benchmark tests truly are, how well they correlate with real world performance. Hint: Some, but not as much as we’d like to believe.
Plain and simple, you must always take mobile benchmark tests with a grain of salt, and there is a multitude of reasons why. There are also a handful of different, standard benchmarks we could use as an example. But due to recent controversy, AnTuTu makes the best example of them all.
Benchmarks and real world performance
The Optimus G Pro devoured benchmarks, but still lagged in daily usage.
We’ve come across a handful of high-powered handsets which chew synthetic benchmarks up and spit them out. Take the Galaxy S 4 as an example. In our reviews of the international, AT&T, Sprint, and Verizon models, the Galaxy S 4 averaged between 22,000 and 23,000 in the AnTuTu test, over 3,100 in Geekbench, and around 850ms in the SunSpider Javascript test. Despite its quite impressive scores, Joe, Michael, and I all experienced stuttering and tiny hints of lag throughout usage. The HTC One, on the other hand, powered by the same chipset, managed to withstand similar abuse with no trace of lag.
One of the tablets we’re currently reviewing is another great example, the Galaxy Tab 3 10.1. It’s powered by a 1.6GHz dual-core Intel Atom chip, which certainly isn’t the most impressive CPU and GPU combination to date, by any means. But it should offer plenty of horsepower to muscle through basic, everyday tasks. In AnTuTu, the Tab 3 10.1 has averaged around the 20,000 mark. Yet it’s virtually impossible to power on the tablet and use if for any amount of time without encountering excessive stutters, lag, and hesitation system-wide.
In a nutshell, specs, benchmarks, and real world performance don’t always see eye to eye. In fact, they rarely do.
Consistency and support
With Android, one of the toughest challenges for benchmark developers is maintaining support for various chipsets, software versions, and new processor technologies. EE Times’ Jim McGregor reveals some discrepancies in an AnTuTu update, Intel’s claims of a superior processor with better performance and less power draw, and the constantly varying results of different benchmark tests.
Powered by an Intel Atom chip, the Galaxy Tab 3 10.1 performs well in benchmarks, but no so much in daily use.
McGregor explains that between updates of synthetic benchmarks, it’s common to see changes in test results, which makes sense. But between AnTuTu version 2.9.3 and 3.3, results for the Intel processor increased 122 percent with a 292 percent increase for the RAM score. For an Exynos chip, the improvements weren’t nearly as generous; it only experienced an improvement of 59 percent, and an increase of 53 percent in the RAM test.
The Register also revealed McGregor’s suspicions were spot-on. For ARM-based chips, AnTuTu uses the open source GCC compiler, says The Register’s Neil McAllister, while AnTuTu for Intel chips uses ICC for versions 2.9.4, forward. ICC, for those wondering, is a proprietary compiler designed by … Intel.
Imagine that.
On top of all that, there are major discrepancies between devices, reviews, different outlets, and even individual tests. Run Quadrant Standard once, you might score a 6,000. The next time you may score 8,000. Even running a dozen tests and averaging them doesn’t really make the scores any more helpful.
Targeted optimization
Further, it’s not difficult for OEMs to optimize their own devices for benchmarking.
In December 2012, a blog was posted to the AnTuTu Labs website simply titled “Stop cheating.” The post explained that manufacturers, instead of optimizing overall performance, were optimizing software to assist their devices’ performance in benchmarks.
This isn’t specific to manufacturers either; this happens in various custom ROMs, as well. A device may score 12,000 in AnTuTu with the stock software. The same device may score upwards of 20,000 with a custom ROM and kernel flashed. The problem, however, is that while the users may see a 167 percent improvement in benchmark tests, but they will never see the same improvement in everyday performance – only a marginal improvement, if any.
How do we make sense of it all?
This is why I have never put a ton of faith in benchmark numbers.
That said, throwing all benchmarks to the wayside for fear they mean nothing is … not a good approach. Putting 100 percent faith in benchmarks isn’t a logical approach either. The numbers don’t may not make a lot of sense and may be flawed, but if one manufacturer is “cheating” to get better scores, so is another. Chances are, most companies are boosting their benchmark scores. And while the numbers may not ever be truly accurate and correlate with real world performance, it’s the only decent way to compare devices … quantitatively.
The best approach is to take a balanced mix of real life performance and benchmark scores. Benchmarks will never tell you if a device is going to lag. Likewise, clock speeds and our word will never quantify the level of a device’s performance compared to its counterparts. But together, the two samples of data will likely give you a better overall picture of how a device will perform once it’s in your hands.


